How to create a simple data collection app with a few clicks

How to create effective and clutter free visualization?
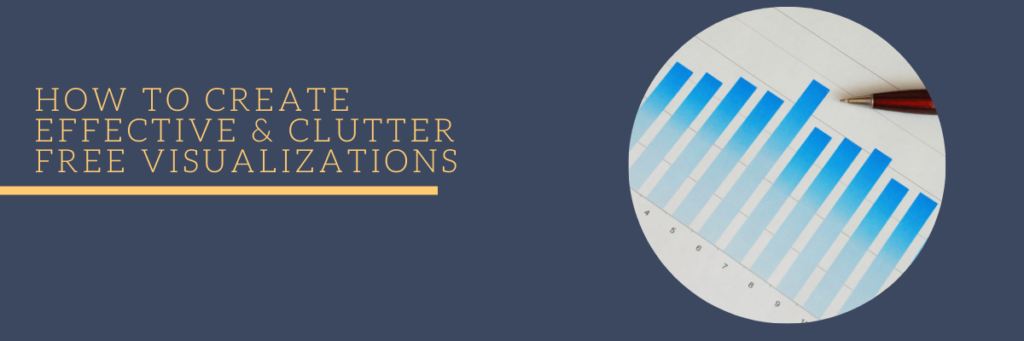
Data visualization is a technique in which information/data is represented in a pictorial form such as map or graph. It is much easier for human brains to comprehend information through visuals than rows of data. With large variety of tools present in the market, it is extremely easy to create a fancy and impressive visualization with […]
How to improve your Data Visualization with Annotation in Tableau?

From hoardings to social media to reports to advertising, today’s world is more visual than ever. As our brain absorbs and processes images 60,000 times faster than text and 90% of information is stored in pictorial format in our brain.1 With the massive development of tools for Visualization, the choice of appropriate visualization has become an extraordinarily complex process. Though tools provide generic charts/graphs, sometimes it becomes difficult to […]
How to perform Pareto Analysis in Power BI

How to get insights from data within 10 minutes using Power BI

So, you have your business data and you want to get “insights” from it? Let’s get busy learning how to go about it. Insights – the misunderstood term? Let’s first understand what we mean by insights. Let us say that you run a business. The number of moving parts in the said business might be manifold. Each […]
How to create Report page tooltips in Power BI?
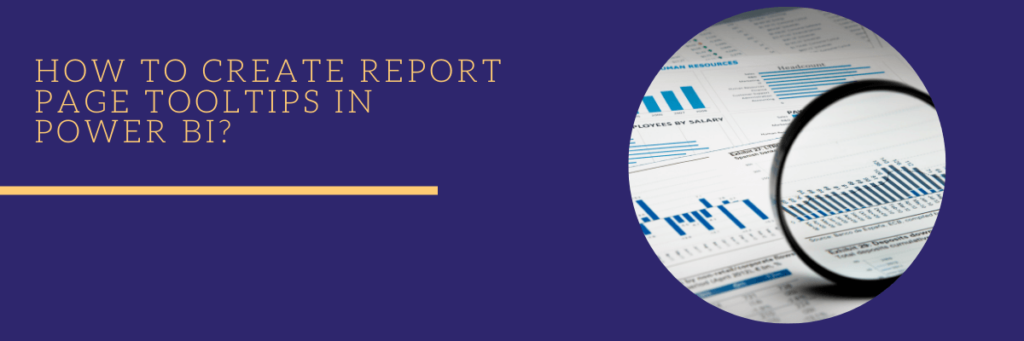
Report Tooltip is a classic and smart way of giving detailed information to the data point of power bi visuals. It is actually a custom report tooltip created in a new page size template, where you can include different visuals, text boxes, images, and other items also to make the tooltip elegant on the basis […]