
Every data analyst must handle raw data, extracting it from multiple sources and performing essential cleanup tasks. With experience one realizes that this requires more skill than tool knowledge due to varied issues in raw data.
So, if you are a beginner then key questions include:
- What are common raw data issues?
- What are their implications?
- Is there a consistent methodology for working with raw data?
Let’s explore 10 essential data cleanup steps that can be applied to any raw data. Key observations and understanding the impact of these issues are crucial for effective cleanup.
Observational skills and a consistent methodology are essential for identifying issues and understanding cleanup requirements, making it easier to utilize tools like Excel, Python, or Power BI. The cleaning objectives can be achieved with any tool or scripting language.
Before outlining the 10 steps, let’s examine a sample raw data that I am going to use to help you spot common mistakes. In real scenarios, raw data issues vary greatly, so identify issues relevant to your unique case every time you start work with raw data.

To help with a reference here, I have included a Python script under some of the steps. You can copy those scripts in your Python instance and follow along. The first script helps you to reproduce the raw data I am using.
Python Script:
data = pd.DataFrame({
‘SL.NO’: [1, 2, 3, 4, 5],
‘Order ID’: [1, 2, 3, 4, 5],
‘Customer_ID’: [101, 102, 103, 101, 104],
‘Order Date’: [‘2025/01/15’, ‘2025-02-20’, ‘2025-03-05’, ‘2025/01/15’, ‘2025/04/10’],
‘ProductID’: [‘P001’, ‘p002’, ‘P 001’, ‘P001’, ‘P/003’],
‘ProductCategory’: [‘Art’, ‘book’, ‘CARDS’, ‘Art’, ‘Dairy’],
‘Qty’: [2, 1, 3, 2, 5],
‘Price’: [‘INR50’, ‘INR 30’, ‘INR 50.00’, ‘INR50.00’, ‘INR 20’],
‘Discount’: [0.1, 0.0, None, 0.1, 0.0],
‘Total_Amount’: [90, 30, 120, 90, 100],
‘MainAddress’: [‘123 Main St’, ‘456 Elm St’, ‘ ‘, ‘123 Main St’, ‘321 Pine St’],
‘Notes’: [‘Urgent’, ‘NA’, ‘Gift wrap’, ‘Urgent’, ‘None’] })
1.Display basic information about the dataset
- Observe: At this step, you spend time getting aware of the basic metadata about the raw data source such as whether it is a CSV file, XLSX file, TXT file, or if data is being imported directly from a database or parsed from a JSON format to create a raw table. It is also necessary to know the total number of rows and columns and the general volume of raw data you are handling.
- Example: A CSV file might result in errors in reading the first row as column headers, an XLSX file format might lead to issues in reading worksheets incorrectly, or data format errors might occur because of the data being in a table format or not. Issues may arise due to missing or inconsistent commas, extra commas, extra cells, improper use of quotes, and character encoding problems.
- Implication: The basic information on the source will help determine if any additional metadata needs to be removed or ignored from the raw dataset. It will also indicate if errors occur in reading the data from its native format such as CSV, XLSX, TXT, JSON, API, and others as highlighted in the example above.
- Ideal step: If the source file format is inconsistent or erroneous, it is necessary to correct the source file first. For example, saving an Excel file as a CSV file to achieve a compact file size and compatibility with a broader range of tools.
2.Sample the first few rows:
- Observe: In this step, visually inspect raw data to understand column formats and sample rows.
- Example: Sample the first few rows and the last few rows, see the records under each column, understand the formats of the numbers, text, symbols or any other record, it will give you insights on the unique scenario in front of you such as address contains Zip codes, Price is with currency symbols.
- Implication: This observation will help determine the subsequent cleaning steps applicable to your scenario such as columns like Price prefixed by INR are visually helpful but turn numeric columns into strings, complicating calculations.
- Ideal step: Sampling gives a quick data overview, and you should enlist all your observations in a separate note that you could refer to as you proceed.
Python Script: print(data.head())
3.Check the column-wise data types
- Observe: In this step, each column type should be checked against the data type that the tool has converted it to after importing the data. For example, using Python, Power BI, or Excel, each of these tools will have a default data type assigned to each column once the raw data is opened.
- Example: For instance, a Price column may be read as a String, or the date column may frequently not be read as a date type and instead be converted to a String. Similarly, a numeric column such as discount with a percentage sign or in decimals may not be properly interpreted.
- Implication: If the column data types are not correctly converted, it may lead to errors in subsequent steps. For example, if a date column is read as a string and used as such, time series-based analysis could be inaccurate. Likewise, a discount figure like 0.10 or 10% requires appropriate handling in downstream steps.
- Ideal step: It is important to verify the data types of each column to ensure they are suitable for analysis and convert the column to the correct data type in situations where it isn’t.
Python Script: print(data.dtypes)
4.Remove irrelevant columns
- Observe: Often, raw data extracted from a source system may include unnecessary columns that were added during extraction. Additionally, you may have a raw data set containing over 25 columns, but only a few of these are relevant to your data analysis. This situation signifies the presence of irrelevant columns in the context of your analysis.
- Example: You can see in our sample raw data a column labelled “SL.NO” in addition to “Order ID,” is an irrelevant column. Similarly, an address field might not be meaningful data for subsequent analysis.

- Implication: Including irrelevant columns adds noise to your data, which affects the efficient use of computational resources, necessitates additional steps in data visualization, requires extra efforts to summarize, and can lead to unnecessary errors.
- Ideal step: Remove columns that are not necessary for analysis. For instance, remove the ‘SL.NO’ column.
Python Script: data = data.drop(columns=[‘SL.NO’])
5.Fix structural issues
- Observe: Review column names and sample rows to identify structural inconsistency, which are not errors but irregularities in the data.
- Example: Column names, you can see there is no consistent naming convention in our data set.
![]()
Similarly, you can see with a column such as Product ID there is no consistent naming convention, these are not errors but what I call structural issues.

- Implication: If not fixed, these issues will cause incorrect summarization and make code maintenance, reports, and data refresh cycles highly labor-intensive. They must be cleaned and standardized before analysis begins.
- Ideal step: Ensure that the dataset has a consistent structure. For example, we might want to rename columns for consistency.
Python Script: data.columns = [‘OrderID’, ‘CustomerID’, ‘OrderDate’, ‘ProductID’,’ProductCategory’, ‘Quantity’, ‘Price’, ‘Discount’, ‘TotalAmount’, ‘MainAddress’, ‘Notes’]
6.Deal with missing values
- Observe: Check for missing values in columns and calculate the percentage of missing records.
- Example: In our dataset, the column “Discount” has a blank field. This is a missing record.

- Implication: To understand the implications, calculate the percentage of missing records. In the example above, with 5 rows total and 1 missing, the missing record percentage is 20%. This helps determine whether we need to fix it and how. Generally, if less than 20% (ideally 10-15%) of records are missing, you can fix them and proceed with meaningful analysis. If more than 25% of records are missing, meaningful analysis will be difficult.
- Ideal step: Handle missing values appropriately using data imputation techniques or simple business logic, or simple labelling. Here, we will fill missing values in the ‘MainAddress’ column with ‘Unknown’.
Python Script: data[‘MainAddress’] = data[‘MainAddress’].replace(‘ ‘, ‘Unknown’)
7.Handle duplicate rows
- Observe: Identify duplicate rows where all column values are identical.
- Example: Note the two highlighted duplicate records in the dataset.
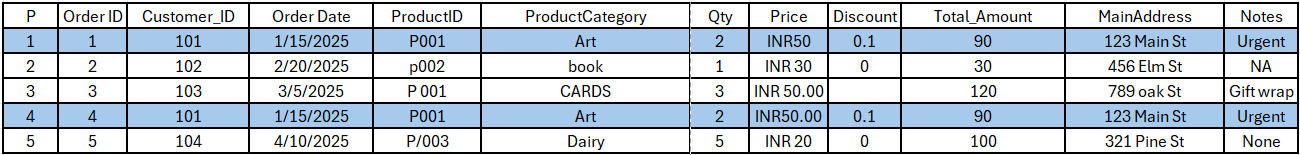
Observe that these two records share the same order date and all other columns, except for the order ID. It is unlikely they will represent different orders for the same customer and product on the same date.
- Implication: Unchecked duplicates can lead to incorrect calculations in downstream tasks, making data seem unreliable and of poor quality, causing inconsistent analyses. Additionally, duplicates must be identified and removed to ensure only the original transactions remain unaffected.
- Ideal step: Remove duplicate rows to avoid redundant data.
Python Script: data = data.drop_duplicates()
8.Check for outliers in descriptive statistics for numerical columns
- Observe: Examine the statistical spread of data in the numerical columns. Basic statistics such as Inter Quartile ranges, Median, Mean, Variance, and Standard deviation can help identify extreme values that lie outside the statistical limits and may not have practical significance.
- Example: An age column with a value of 220, or a quantity column having one record with a value of 20,000 when most other records average around 200, are likely typographical errors or junk values.
- Implication: Retaining these outliers can affect statistical values such as sum, average, and ratios of the column data, potentially skewing business insights.
- Ideal step: Identify outliers in numerical columns using descriptive statistics and remove them or replace them.
Python Script: print(data.describe())
9.Check unique values in categorical columns
- Observe: Look at the unique values in categorical columns to understand your data’s dimensions and ensure consistency without structural issues.
- Example: In our data set notice the unique values in these two columns in the dataset.


Both columns are categorical data types but have structural issues. The ProductCategory column has inconsistent capitalization, and the Notes column contains “NA” and “None”.
- Implication: It is necessary to standardize the categorical data and resolve structural issues. For example, in the Notes column, it needs to be clarified whether “NA” and “None” are the same, or if “NA” stands for “Not applicable” and “None” means “No comments provided.” This decision requires business context and is crucial for accurate downstream data analysis and visualizations, to prevent ongoing confusion.
- Ideal step: Check the unique values in categorical columns to ensure data consistency and fix the data inconsistencies within the unique values.
Python Script: print(data[‘ProductID’].unique())
10.Transform date column
- Observe: In this step closely observe the format of the date column across the data set. Also, note the time zone to which the raw data belongs to and the format of the time stamp too if a time stamp is present.
- Example: In the raw data, observe the ‘Order Date’ column.
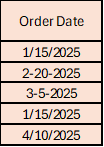
The date format is inconsistent within each record, using both / and -. Additionally, it’s unclear whether the format is DD/MM/YYYY or MM/DD/YYYY.
- Implication: Incorrect formats or interpretations can lead to erroneous data analysis, placing data in the wrong month, quarter, or week. Furthermore, not accounting for time zones can cause discrepancies if raw data in UTC time zone is analyzed as if in IST time zone, resulting in a 5.30-hour difference and inaccurate daily summaries.
- Ideal step: Convert the ‘OrderDate’ column to a datetime format for easier manipulation and handle the time zone difference if any.
Python Script: data[‘OrderDate’] = pd.to_datetime(data[‘OrderDate’], format=’mixed’)
In conclusion, effective data cleaning is crucial for any data analysis. A meticulous approach enhances the accuracy of analysis and leads to more impactful data-driven decisions. Embracing these tasks improves the quality of your work and contributes to successful analytics.