Why Connect Power BI Desktop to Google Sheets?
Before discussing the technical steps, let’s understand why this connection is useful. Many organizations use Google Sheets to manage functional data, particularly for monthly data collection by small teams. For instance, in a manufacturing company, an inventory management team tracks daily stock levels by entering unit counts into Google Sheets. By month’s end, you have a complete dataset of daily entries. Each new month adds a sheet to the workbook, effectively turning Google Sheets into an inventory tracker.
Another team that receives inputs from the inventory management team requires this monthly sheet for further analysis. By connecting Power BI Desktop to Google Sheets, that team can:
- Analyze and visualize data stored in the sheets.
- Create dynamic dashboards to monitor KPIs.
This integration leverages Google Sheets for data input and Power BI for analytics. It also enables automated updates, ensuring changes in Google Sheets are accurately mirrored in Power BI reports.
This blog post explains how to connect to Google Sheets and establish your first connection. For details on automating updates, especially after the first month, check my second blog here: Dynamically update Google sheets
Step 1: Prepare Your Google Sheet
Background: To ensure a seamless integration with Power BI, it is essential that the Google Sheet is correctly formatted. This involves organizing the data into rows and columns and ensuring there are no blank headers. If the sheet is already properly formatted, you can use the data directly upon import into Power BI. Otherwise, any formatting issues will need to be addressed within Power BI, requiring the use of the Power Query Editor to clean or transform the data.
Context: In this scenario, a simple Google sheet has been prepared with two columns as shown below. Carefully observe the sheet to replicate it in your own Google sheet. It is deliberately left unformatted to demonstrate how to address common issues that arise when a Google sheet is not properly formatted, which is often encountered in enterprise data.

Instructions:
- Log in to your Google account and open Google Sheets.
- Create a new spreadsheet and name it “Monthly Stock Levels”.
- Add two columns as specified, name the sheet “April”, and input data for all 30 days of April.
- Save the spreadsheet.
Step 2: Note the URL of Google Sheet
Background: Power BI Desktop cannot directly access Google Sheets stored on your account. It requires authentication of your Google login credentials to access a Google Sheet that has not been published. If you choose to publish the Google Sheet to the web, it generates a link that Power BI can read without credential authentication since it is a publicly accessible URL. However, this makes the data accessible to anyone with that link.
Context: In this scenario, I will not be publishing the Google Sheet, as is commonly the case with most enterprise data. Instead, I will connect to the Google Sheet from Power BI by providing my Google credentials to authenticate the connection. This approach ensures the security of my data on Google Sheets.
Instructions:
- Open your Google Sheet.
- Click on the browser bar and copy the URL from your sheet.
Paste this URL into a notepad, as you will need it to connect Power BI to your sheet.

Step 4: Launch Power BI Desktop and Create a New Report
Background: In this step, work in Power BI Desktop to prepare for importing your Google Sheet data. Ensure you have the URL of the Google Sheet and the necessary Google credentials for authentication.
Context: In this scenario, I will create a blank Power BI report in Power BI Desktop. Next, I will connect to my Google Sheet using my Google credentials. Use your Google Sheet URL and credentials when prompted.
Instructions:
- Open Power BI Desktop.
- Select Blank Report if prompted.
- Click on Get Data.
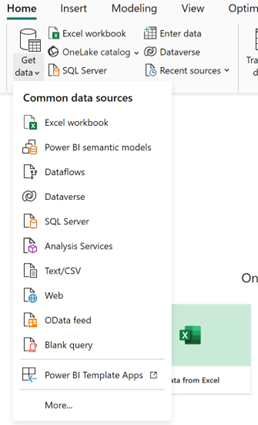
- Search for Google in the connectors list
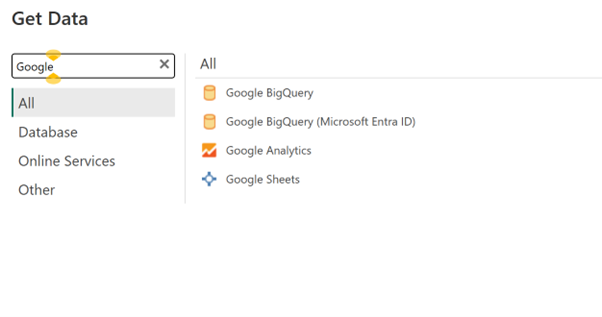
- Select Google sheet in the list

Step 5: Connect to the Google Sheet
Background: The next step involves creating a connection between Power BI Desktop and your published Google Sheet.
Context: In our current scenario, the Google sheet has not been published. Thus, it remains private and requires authentication with Google credentials.
Instructions:
- Choose Google Sheet from the connector list and select the connect option.
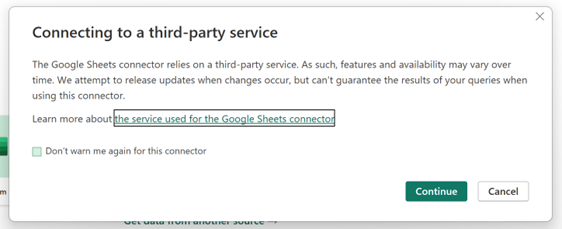
- A prompt for third-party connector information will appear. Please click continue to proceed.
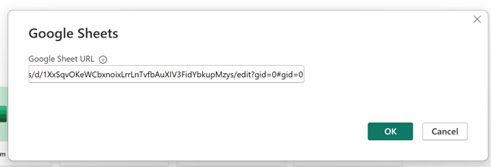
- Insert the URL from your notepad into the Google sheet URL box. Click Ok.
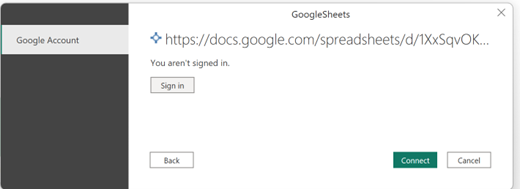
- Power BI Desktop will prompt you to sign into your Google account. Click the “Sign in” button below the message “You aren’t signed in”
- You will be redirected to a new browser window to log in to your Google account.

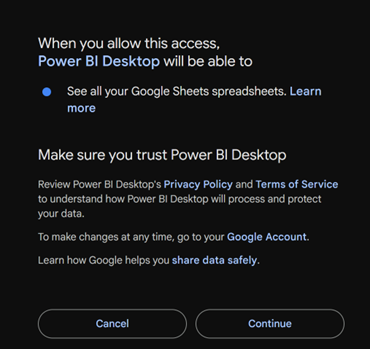
- Complete your Google authentication. After successful authentication, you will see the message below as it is your first time. Review the terms and conditions, then click continue.
- Click continue to see the message in your browser.
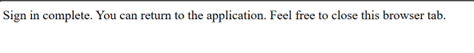
- Close the browser tab and return to Power BI Desktop. In Power BI Desktop, you will see the following message:
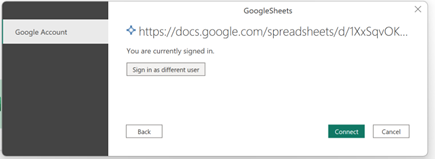
- You have successfully authenticated your Google credentials for the Power BI connection. Please proceed by clicking the connect button.
- Power BI will access your Google Sheet data.
Step 6: Transform the Data
Background: Data imported from Google Sheets often needs modifications before it is suitable for visualization. Power BI’s Query Editor tools are valuable for making these necessary adjustments.
Context: In our scenario, it is important to thoroughly examine the Google Sheet containing the raw data, as it is currently not properly formatted. For instance, you will observe that the first row and column A are blank. The actual data begins in columns B and C, starting from row 2. This formatting issue requires adjustments within Power BI before we can proceed with visualizing the data.
Instructions:
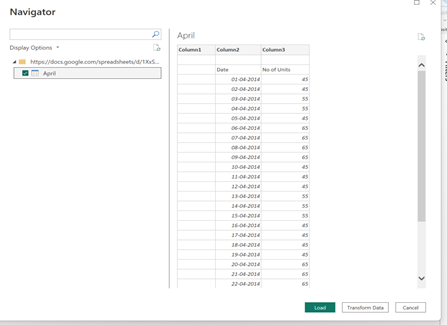
- Select the April sheet name in the Navigator pane below the folder that refers to the Google Sheet destination. The data preview will be visible in the adjacent pane.
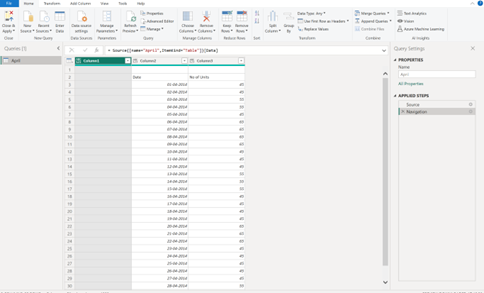
- To address issues such as column names and initial blank rows and columns, use the Power Query editor to clean or reformat the data. Click the “Transform Data” button to open the Power Query Editor.
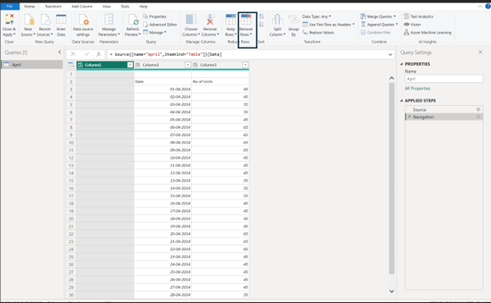
- To begin, we shall eliminate the unnecessary rows. Kindly select the “Remove rows” option located in the top menu under the home tab and then choose to remove the top rows.
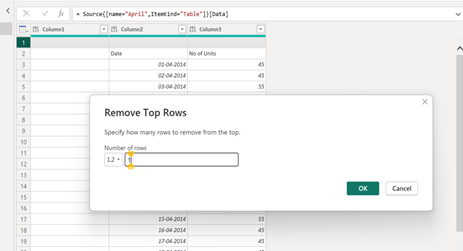
- In the remove top rows window, enter 1 as the number of rows because there is only one blank row in the raw data. Click “Ok”.
- The first row, which was blank, has been removed.
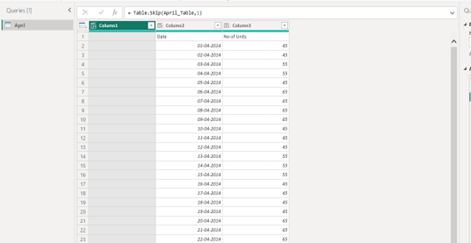
- The first row is removed, but headers are read as Column 1, 2, and 3 instead of Date and No of units. This needs to be corrected in the next step.
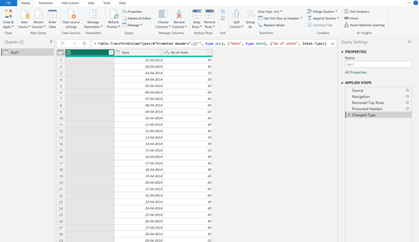
- To set the first row as a header, right click the table icon in the corner and select the option “Use first rows as header”.

- The column names will be changed to Blank column, Date, and Number of Units.
- To remove the unwanted blank first column (highlighted in green), right-click the selected column and choose “Remove”.
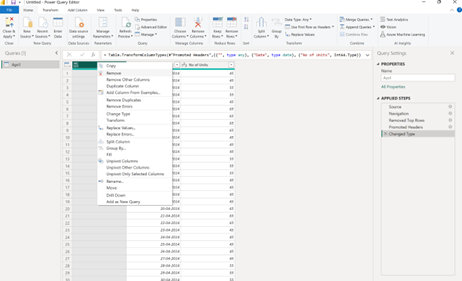
Our data has been corrected for the formatting errors in the Google Sheet. You can now click “Close and Apply” to use the data for visualization in Power BI.

Step 8: Refresh the Data
Background: A significant advantage of integrating Power BI with Google Sheets is the capability to automatically refresh data. This feature ensures that your reports remain current whenever modifications are made to the Google Sheet.
Context: In our scenario, you can add data to the Google Sheet daily. Once the data has been added, you should open Power BI Desktop and select the Refresh button located in the Home tab. Alternatively, if you publish your report online, you may configure scheduled refreshes within Power BI Service.
Conclusion
Connecting Power BI Desktop to Google Sheets is simple with step-by-step guidance. This integration enables users to analyze data and create interactive dashboards for informed decisions.
Follow this beginner-friendly guide to connect and explore your data in Power BI Desktop.