Background and Context
In this part 2 blog of “How to connect Google Sheets to Power BI,” I cover connecting Power BI Desktop to a non-published Google Sheet after user authentication, building on the basic steps introduced in part 1. Read part 1 here: Connect Google Sheets to PowerBI
In this blog, I’ll use the same sheet from Part 1 but focus on combining multiple Google Sheets and dynamically updating them in Power BI. Let’s revisit the business context of the data used.
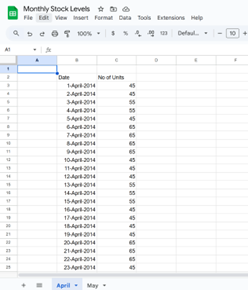
Many organizations use Google Sheets to manage functional data, particularly for monthly data collection by small teams. For instance, in a manufacturing company, an inventory management team tracks daily stock levels by entering unit counts into Google Sheets. By month’s end, you have a complete dataset of daily entries. Each new month adds a sheet to the workbook, effectively turning Google Sheets into an inventory tracker.
In a previous blog, we learned how to connect to a Google Sheet. This raises the question of what happens when the Google Sheet is updated with new data for subsequent months like May and June. Is there a dynamic way to update this data refresh into a single Power BI file as one table? The following steps will explore how to achieve this.
Step 1: Prepare Your Google Sheet
Background: Our data is in a Google Sheet organized by month, with two columns. The April sheet contains 30 days of data, and the May sheet has 31 days of data. Both sheets have the same column names but different row counts.
To combine April and May data in Power BI Query Editor, ensure the columns have the same names. This allows the data to be merged into one table. The steps in Power Query Editor need to be configured once, and for each monthly refresh (June, July, August), the data will dynamically update.

Step 2: Refresh the Google Sheets
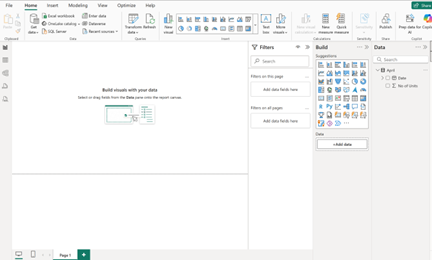
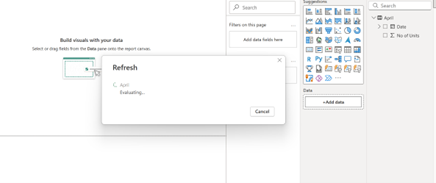
Background: We have previously connected Power BI Desktop to a Google Sheet containing data for the month of April. With the addition of data for May in a new sheet within the same Google Sheet, it is necessary to click the refresh button in our Power BI file to import and integrate the data from the May sheet.
In Part 1 of this blog, I created a Google Sheet with April data and connected to it. Now, I have added a new May sheet with May data. I will open my old Power BI file and refresh the data from the Google Sheet.
Step 3: Move into Power Query Editor
Background: After updating our older Power BI file, the new May data is now visible in Power Query Editor. We need to combine the monthly data into one table in Power BI and set up a dynamic update process for this data from June onwards.
When the data is refreshed, it is necessary to access the Power Query Editor and reverse a few steps to view the data from both the April and May sheets. This action enables the combination of data at the source file level, facilitating dynamic updates for subsequent months, such as June and beyond.
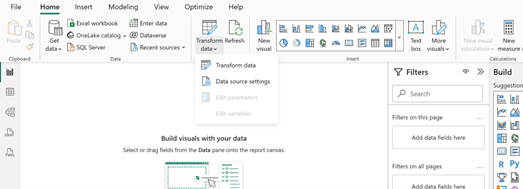
Click on Transform Data and enter into the Power Query Editor
In the Power Query Editor, select the April table to view all the steps performed in Part 1 of the blog.
Now click on the “Source” step to see both April and May data

Step 4: Power Query Editor Source
Background: To dynamically update Google Sheets data and combine April and May sheets into one table in Power BI, we need to undo the steps following the “Source” step in Power Query Editor.
I am using the same file from Part 1 of the blog. First, I need to undo the steps taken when initially connecting the Power BI file to my Google Sheet.
Right-click on the “Navigation” step in the Power Query Editor window.
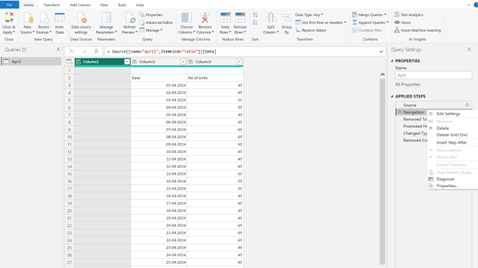
Click “Delete Until End” and the window below will appear.
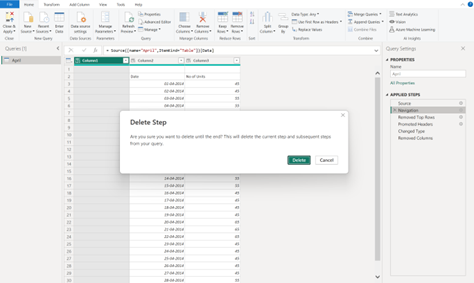
Confirm by clicking the “Delete” button. In the Power Query Editor, only the “Source” step will remain. This step is crucial as it involves accessing the source and combining data from multiple sheets.
Step 5: Transform Source Data coming from Multiple Sheets
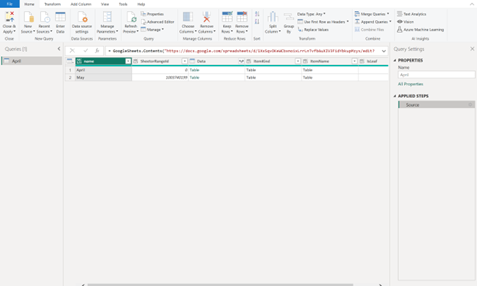
Background: Within the Power Query Editor, resetting the steps to “Source” allows us to view the metadata that Power BI reads from our source file, which in this case is a Google sheet. As demonstrated in the screenshot below, the metadata contains the data for April and May as table objects within the “Data” column.
![]()
To merge the data from April and May into a single table and enable dynamic updates when June data becomes available, it is necessary, at this Source step, to retain only the “Data” column in the metadata being read by Power BI Desktop.
Right-click the “Data” column.
![]()
Select “Remove other Columns” to keep only the “Data” column from the metadata. Click it and the screen will appear as shown below.
![]()
We’re ready to merge data from multiple sheets.
Step 6: Combine the data
Background: At the “Source” step in Power Query Editor, Power BI reads the metadata of the source file and holds the data from the April and May sheets as a table object in the column “Data”. The next step involves expanding the table object to access the required data.
The data from the April and May sheets will be accessed upon expanding the “Data” column. As noted in Part 1 of my blog, the formatting of the data within these sheets is suboptimal. Consequently, Power BI will interpret the data with these existing issues, such as inaccurately reading column names.
Click the expand icon in the “Data” column to view the window below.
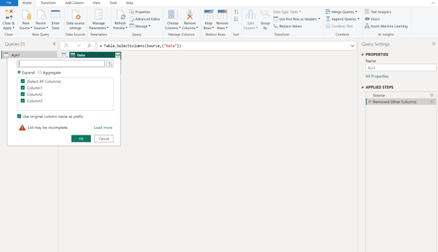
Deselect the option “Use original column name as prefix”. In this instance, since the column names are not being read correctly, selecting this option is unnecessary. The issues with column names will be addressed in the following steps.

Click Ok to view the next screen:
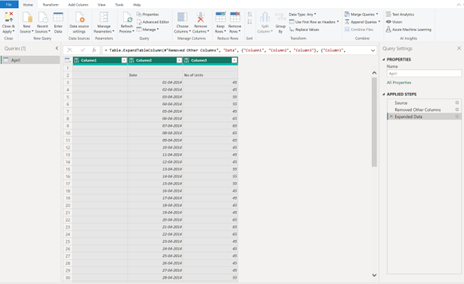

After combining your data, the following issues are evident:
- Column Names: The issues from the source Google sheet persist due to poor formatting.
- Addition of blank row: After the April data (30 days) ends in the table, an additional blank row appears before the May data column names.
- Column names in the row: Before adding the May data to the same table, the column names from the May sheet are included as an additional row, followed by the May data.
We need to transform the data once to resolve the issues noted earlier.
Step 7: Transform the combined data for dynamic updates
Background: Combining data from the Table object in Power Query Editor has introduced blank rows, column names as rows, blank columns, and incorrect column names. Starting with a well-formatted Google Sheet would reduce these issues.
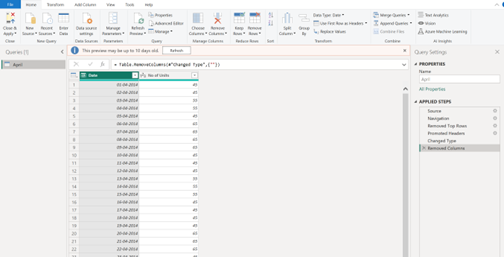
In this scenario, we address issues with additional blank rows, column names as rows, and source file format problems. Refer to Part 1 blog url: here for steps to clean up these issues. Upon completion, the Power Query Editor’s Applied Steps window will display the recorded steps as shown below:
![]()
After cleaning and transforming the data, observe the following:
- The column names are “Date” and “No of Units”
- There are only two columns
- April and May data are within the same table as subsequent rows
- The queries window shows only the “April” sheet initially connected
Step 8: Enable Dynamic Updates
Background: The April and May data from the “Source” Step in Power Query Editor has been combined, enabling a dynamic update of this data from the Google Sheet once the June data is added as a new sheet to the same Google file. Ensure that the format for June matches that of April and May in the Google Sheet.
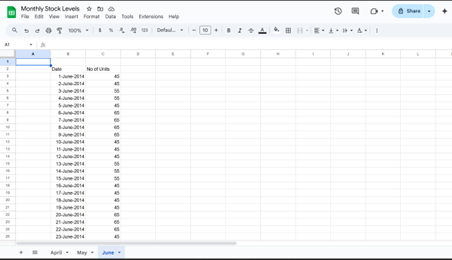
I added the June sheet to my Google source file, with the same issues and column names as April and May. It tracks “Date” and “No of Units” daily. June data is below.
Please proceed to the Power BI file, open the Power Query Editor, and select “Refresh All” under the Refresh Preview tab.

The June data has been updated in the table, following the May data.

Upon configuration, Power BI will automatically update your report with the latest data from Google Sheets for subsequent months starting from July.
Conclusion
Such an integration of Google Sheets with Power BI removes the need for manual monthly updates. It consolidates data into a single table, builds historical data, and enables powerful analytics and dynamic updates, facilitating easy data-driven decisions.
This integration enhances productivity for businesses and individuals using Google Sheets for data collection and Power BI for analysis. It streamlines workflows for managing sales pipelines, tracking projects, or analyzing customer feedback.