It is essential for finance teams to monitor budget versus actual performance. This analysis can be conducted at the cost center level, by month, or according to other relevant organizational hierarchy parameters. Accordingly, data should be readily accessible at the specified level of detail.
When creating a finance report in Power BI, it is common to include Budget vs Actual performance tracking. This typically involves calculating the variance between budgeted amounts and actual amounts, as well as highlighting variance threshold levels or flags to indicate areas that meet expectations and areas that may require further review.
This blog provides a step-by-step guide to constructing a report that compares budgeted figures with actual results. The report also incorporates color-coded variance indicators to facilitate the identification of potential issues.
Step 1: Prepare Dummy Data
To follow along, you will need some sample data. Let’s create a single excel sheet with three simple tables: one for the budget, one for the actuals and one master table for cost centres. Within the excel sheet create one sheet for each of these tables.
- Table 1: Budget_Data

- Table 2: Actual_Data

- Table 3: Cost_Center

You can copy these tables into the respective sheet in Excel and then import them into Power BI Desktop.
Step 2: Load Data into Power BI
- Open Power BI Desktop.
- Click Home > Get Data > Excel and select your file.
- Import both the Budget_Data, Actual_Data and Cost_Center tables.
- During data import, carefully review the table structures and column formats for any inconsistencies.
- If issues arise, such as BudgetAmnt and ActualAmnt not being recognized as numeric values, update the data types accordingly within the Power Query Editor.
- Additionally, ensure consistent column naming conventions across all tables to facilitate the creation of relationships.

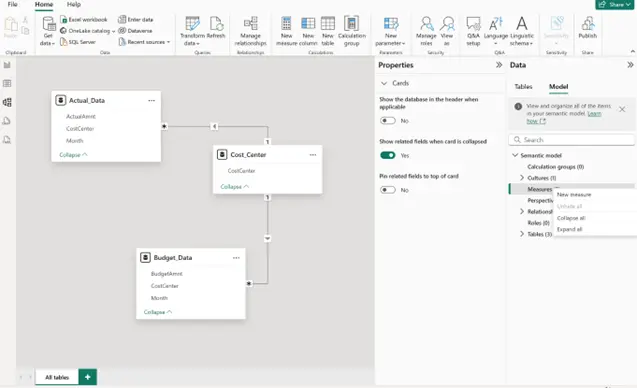
Step 3: Join the Tables
Now relate the three tables so you can compare them.
- Go to Model view.
- Drag to connect Month field from Budget_Data to Actual_Data.
- Drag to connect CostCenter field from Actual_Data and Cost_Center.
- Drag to connect CostCenter field from Budget_Data and Cost_Center.
If Power BI has autodetected these relationships, they will appear linked in Model view.

Step 4: Create a Variance Calculation with DAX
Time to calculate the variance between actual and budget. For this calculation you can use the Quick measure option in the report view or simple DAX formula. I will be using a simple DAX formula to create a new measure in the Model view.
- Click on Model > Measures > New Measure.
- Name it Variance and enter:
Variance = SUM(Actual_Data[ActualAmnt]) – SUM(Budget_Data[BudgetAmnt])
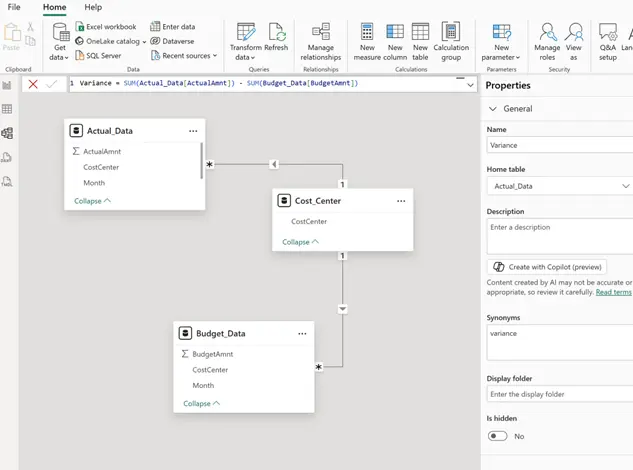
- This measure will show you if you’re overspending (positive) or underspending (negative) compared to your budget.
Step 5: Build the Budget vs Actual Table
- Go to the Report view.
- Add a Table visual.
- Add CostCenter, Month, BudgetAmnt, ActualAmnt, and your new Variance measure.
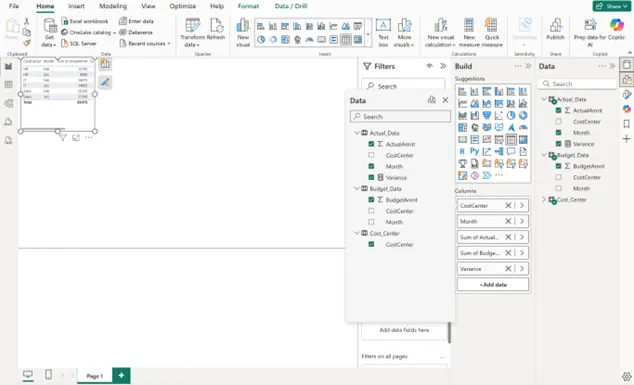

- You can see that the Variance values are showing if you’re overspending (positive) or underspending (negative) compared to your budget.
Step 6: Add Variance Flags with Conditional Formatting
Variance flags can be created by applying conditional formatting, which highlights Variance values with color for easier identification. I will employ two methods for conditional formatting: gradient color and rule-based approaches.
- Select the table visual.
- Right Click beside Variance in the Values area, then select Conditional formatting > Background color.
- Approach 1: Under Format Style, Choose Gradient and then choose color like Red


This method uses one color to display variance movement, with positive values (overspending) shown in dark red.
- Approach 2: Under Format Style, select Rules and configure two colors—red and green.
- The options for creating rules can be complex, as understanding the required logic is essential before proceeding.
- In this example, I have set up the rule so that negative variances (indicative of underspending) are highlighted with a green colour, while positive variances (indicative of overspending) are highlighted with a red background.


You may select the approach that best aligns with your requirements. Certain businesses may prefer a standard red-and-green colour scheme, while others may find a gradient-based colour flagging system appropriate.
Step 7: Add Slicers for Cost Center
To facilitate easier analysis, I will utilise slicers to enable the selection of Cost Centers.
- Click Insert > Button Slicer.
- Drag CostCenter into the slicer field.
- Now, you can filter the table to see details for each cost center individually


After adding the cost centres, you may select any individual cost centre to view its actual versus budget performance on a monthly basis.

Conclusion
Creating a Budget vs Actual report in Power BI can be accomplished by utilizing DAX for calculations, applying conditional formatting to highlight variances, and incorporating slicers for detailed analysis. These steps result in a dashboard that allows users to monitor budget adherence interactively.