In Power BI, the data model you build influences the performance of the report and getting it right is not just a technical detail—it is the foundation for accurate reporting and meaningful insights. Yet, as anyone who has built models for real businesses knows, not all data models are simple. Many-to-many relationships can trip up even experienced users, leading to confusing results and tangled data models.
For example, imagine a university where every student can enroll in multiple courses, and every course can have multiple students. If you try to connect a “Students” table directly to a “Courses” table in Power BI, you will quickly hit a snag. There is no way to capture the fact that a single student can be linked to multiple courses and vice versa. This is the essence of a many-to-many relationship.
You will find similar patterns everywhere:
- Salespeople serving multiple regions, and regions with multiple salespeople
- Doctors treat many patients; patients consult many doctors.
- Customers purchasing multiple products, and products bought by multiple customers
Power BI’s standard relationships are designed for one-to-many or one-to-one links. Many-to-many scenarios require a different approach. They can be managed by using a Bridge Table in the Power BI data model.
What is a Bridge Table?
A bridge table acts as an intermediary, connecting two tables that can’t be linked directly because of their complex relationship.
It is a table that contains the keys (unique identifiers) from both tables involved in the many-to-many relationship. Each row in the bridge table represents a unique pairing between the two tables.
The bridge table “bridges” the gap, allowing Power BI to accurately map relationships and aggregate data across both sides.
Let’s understand this using a real-business scenario. Suppose you manage a sales team:
- Each salesperson can be assigned to multiple sales regions
- Each region can have multiple salespeople
- Each region serves multiple customers
You want to analyze sales performance by salesperson, region, and customer.
Here’s some sample starting data:
-
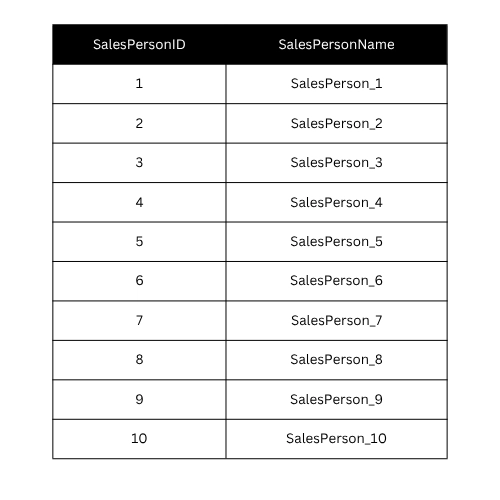
Salespeople Table:
-
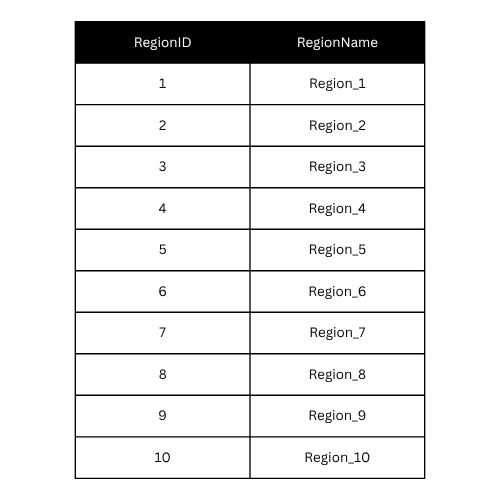
Regions Table:
-
Customers Table:

-
Sales Assignments Table (Bridge Table):

Let me walk through building this model in Power BI
1. Import Your Data
Open Power BI Desktop and click Home > Get Data. Import your tables: Salespeople, Regions, Customers, and Sales Assignments.
2. Set Up Relationships
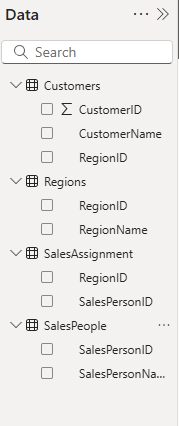
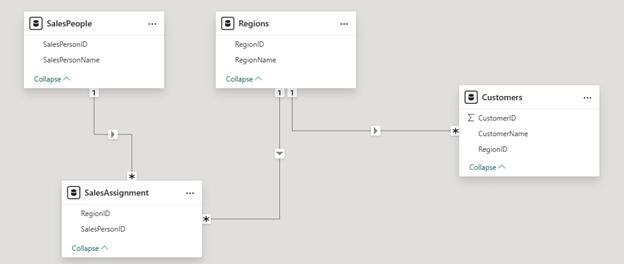
Go to Model View in Power BI. You will see your tables as boxes. Now, create relationships:
- Connect Salespeople[SalespersonID] to Sales Assignments[SalespersonID]
- Connect Regions[RegionID] to Sales Assignments[RegionID]
- Connect Customers[RegionID] to Regions[RegionID]
Both connections to the bridge table should be one-to-many (one salesperson to many assignments, one region to many assignments).
3. Go to Report View to Analyze and Visualize
Now you are ready to build reports. For example, you can:
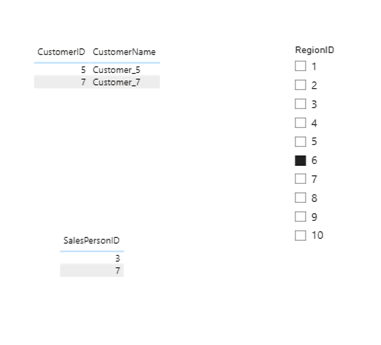
- Use slicers to filter by either salesperson or region and see accurate results
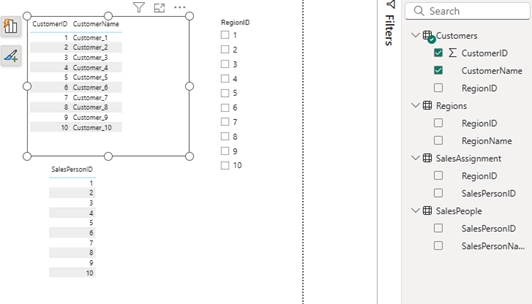
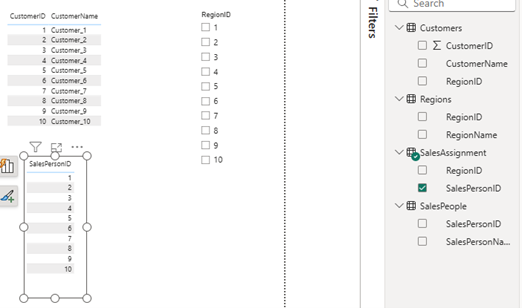
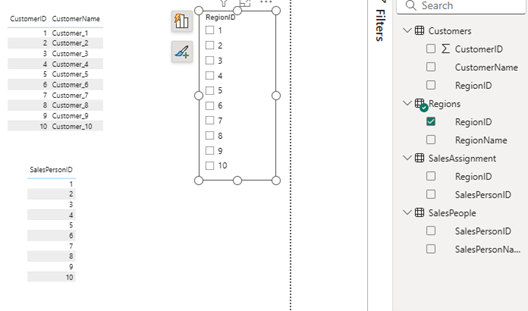
Note the selection of columns under each of the visuals, this is an important step for accurate results in your visuals.
Tips
- Use Clear Naming Conventions: Name your bridge tables clearly (e.g., “Sales Assignments” rather than “Bridge1”).
- Check Relationship Directions: Ensure relationships are set to “Single” direction unless you have a specific reason for bi-directional filtering.
- Optimize for Performance: Bridge tables can grow large. Remove unnecessary columns and use integer keys wherever possible for better performance.
- Troubleshoot Filters: If your visuals don’t filter as expected, check that relationships are set up correctly and that you are referencing the bridge table appropriately.
In conclusion, if you encounter a scenario where records in one table can relate to multiple records in another table (and vice versa), a bridge table is usually the best solution.